The Digital Marketing Stack

Having been a Marketing tags implementation and tool integrations specialist for 3 years, I encountered the mentions of different AdTech and MarTech platform tags like Floodlight, Mediaplex, Bing Ads, Facebook Pixels, Hotjar, Crazy Egg etc., As my core focus was implementing web and app analytics tags using Tag Management tools, implementing the tags of other tools was part of scope. This involved leveraging of DataLayer where needed with basic understanding of what each tools meant.

Understanding of the entire Digital marketing ecosystem beyond just web, app analytics and experiments tools helps in Tag implementation and maintenance efficient.

AdTech and MarTech Tools

Understanding the ecosystem becomes easier if the AdTech and MarTech can be visualized correctly. AdTech tools are used for advertising on paid media channels like search, display, video or social media.

On the other hand, MarTech tools are used to run on-site marketing campaigns on owned channels like like e-mail, on-site banners and supporting tools for web analytics, A/B testing, personalization etc.,

These tools have to be integrated and used for an effective Digital marketing program. This will enable access to many data points and allow specific targeting of audiences.

Website and App are the core component

Simple way of understanding the ecosystem is to position website/app as the core, where conversions happen. AdTech tools bring new visitors or returning targeted visitors to the website/app while MarTech tools help in on-site or in-app activities.

simplified-ecosystem

These tools are integrated and instrumented via tags, API and custom file uploads as a part of Digital Marketing. AdTech stack has a data flow between its components that will help in understanding the marketing stack better. It can be understood in the forthcoming blogs of this series.
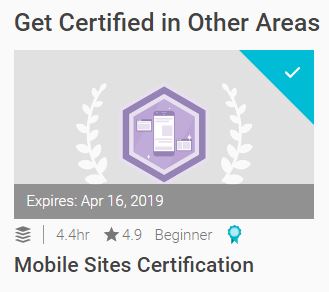
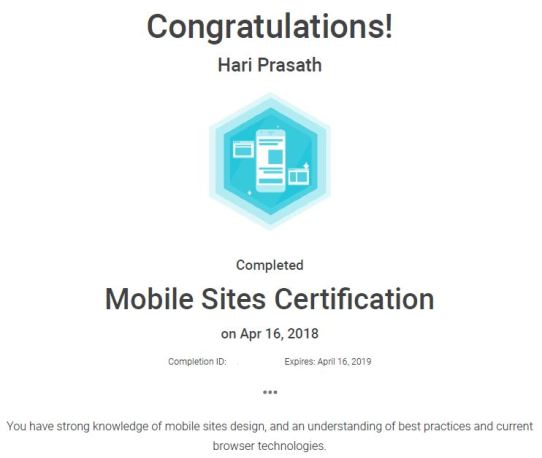
Mobile Sites Certification from Google

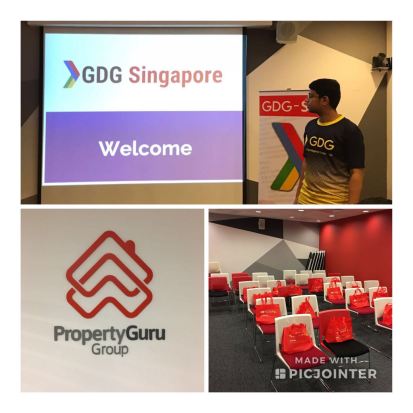
It was my first study jam session as a facilitator for Google Developers Group, SG (GDG-SG). Rahul, Senior Software Engineer at PropertyGuru joined with me in facilitating the session. He arranged the event at PropertyGuru SG HQ and was also a wonderful host.

GDG StudyJam

This post is about the certification and the assessment exam.

About the Assessment

This certification is focused to point out the important optimization factors for mobile websites. The content of the course covers mobile website topics like UI, UX, user design principles, advanced technologies like Progressive Web Apps (PWA) and Accelerated Mobile Pages (AMP).

Target Audience

It is stated that this course is targeted for web developers, webmasters, or technical professionals creating mobile websites to demonstrate your expertise. However, my observation is that it is also suited for product managers, product owners, students and analytics teams who would want to understand what it takes to optimize a mobile site.

The feedback from participants at the study jam session was similar to my observation. One of the participant stated that this course helped add context to the functionalities aspect of what he focuses on as a developer.

The Content

The course has 4 main modules as follows:

  1. Why does mobile site matter?
  2. Improving mobile site speed
  3. User Design Principles for mobile site
  4. Advance web technologies

I liked the module 3 over the others. Google and AnswerLab conducted a research study examining how a range of users interacted with a diverse group of mobile sites. The study uncovered 25 mobile site design principles, grouped into five categories. While these were very common factors we encounter daily, this module reinforced the fact of optimizing them for better UX.

The Assessment Exam

The certification is FREE of cost and has to be attempted at the Academy for Ads learning portal by Google. If you prefer video study materials, this portal has optional videos for preparation. The detailed assessment guide for reading is available in Google Support section (link).

Mobile Sites Assessment-course

  • Questions: The assessment is made up of 65 questions
  • Time limit: You’ll have 90 minutes to complete the assessment
  • Passing score: You need to get a score of 80% or higher to pass
  • Retake period: If you don’t pass the assessment, you can take it again after 1 day
  • Available languages: simplified Chinese, traditional Chinese, Dutch, English (UK), English (US), French, German, Italian, Japanese, Korean, Polish, Portuguese, Portuguese (Brazil), Russian, Spanish, Spanish (Latin America), Thai, Turkish, and Vietnamese

The result is shared immediately and the certificate is provided at the same time, if you passed.

Mobile Sites Assessment

All the best for the exam and happy optimizing mobile sites!

The A/B Testing Culture and Process

In the previous post of this series, you got introduced to what A/B testing is. Before we deep dive into the A/B testing, It is important to understand few factors to be considered for successful experiments.

In this post, you will understand about the culture needed to encourage testing and an intro to the process of A/B testing. The key to run an A/B test is to foster the culture of experimenting and to discipline a process to test.

Fostering the Culture

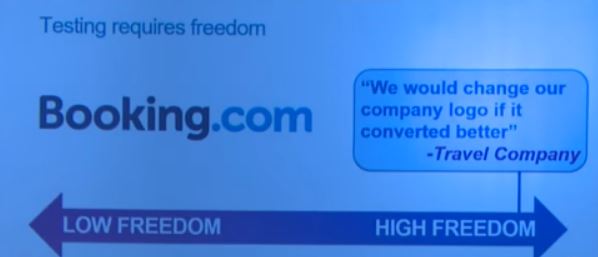
Experimenting and executing tests needs a culture that encourages it. In a talk (video) by Hazjier, Global Head of Strategy at Optimizely, he measures this culture on a scale of “Freedom”. This refers to the level flexibility and liberty teams have to experiment. The following image explains 3 different levels of freedom.

Scale of Freedom to Test

While the levels of freedom cannot be compared because it depends on the company policies and processes, it influences the number and type of tests that can be tried.

He quotes Booking.com , a travel company we are familiar with, as an example for the high level of freedom. It tested the brand names “booking” and “booking.com” to decide the better converting name!

booking

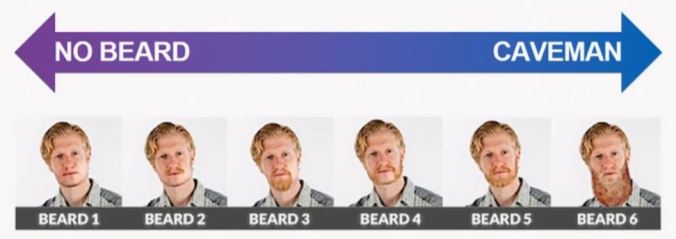
It should test and solve your real problems. A nice example is highlighted in the talk quoted above. A shirt brand tested a male model with different level of beards to be featured on the website.

beard

The Beard 6 variant drove more than twice the conversions by the Beard 1 variant. However, this result cannot be applied across the website as it might not become interesting and users may not click on them. Hence, the problems or hypothesis you test must be prioritized based on the impact of its result.

The Process

The A/B testing has to be run as a scientific process. The results needs to be statistically concluded. The statistical significance makes sure the results are fair covering all scenarios like null hypothesis and the factors affecting users browsing behavior.

The A/B testing process involves the following 6 steps. This is a common framework that can be adapted and modified with additional steps if needed.

A/B Testing Process Iteration

Every step in the process requires certain tools, team work and thought process. Each of these steps will be detailed out in the forthcoming blogs of this series.
Introduction to A/B Testing

What is A/B Testing?

A/B testing is comparing two versions of a web page, button, hero image, newsletter or any component and compare which performs better. The decision is made using goals to compare against each other. The variation with better goal conversion wins.

The “Learn more” button is tested with two variations. Image Reference: link

Multivariate testing is the process of testing more than 2 variations of the component. This blog by Kissmetrics is an interesting post on A/B and Multivariate test – blog.

Conversion Metrics

The conversion can differ between websites based on the purpose of the website. Examples:

  • Sign-Ups to newsletter for a publisher
  • Purchase for e-commerce
  • Outbound click to the target site for an affiliate
  • Time on site for publisher
  • Form submission for lead generators

Components to test

While the goals is very important to decide the winner, the component that will be tested is also equally important.

FB-AB

Facebook tested the message in social ads to make one “like” a page. Reference credits: link

Given the capabilities of tools in market, components like the following can be easily tested:

  • Hero Images on home page or landing pages
  • Call to action buttons
  • Form elements (form length)
  • Menu options
  • Text in the titles, paragraph headings, the paragraph content etc.,
  • Deals shown to users
  • Newsletter email subject and content
  • The price tiers and messaging for subscription or a product

This post is kept to be a simple intro to what an A/B testing is. This will be followed by posts on the A/B testing process, Implementing the test, Stats and factors involved in deciding the winner and few case studies from prominent A/B testing tools in the market.

Aligning Social Media to Business goals

Having mere presence in social media makes no sense to a brand. It is just a waste of productivity and human resources involved behind it. Any organization must have a Goal and Target with respect to its presence in Social Media.

Goal: This is the brand’s desired end point. For example, Increase net new transacting customers.

Target: This is a specific value set to the goal with a finite time frame. For example, 100 net new customers in next 2 months.

Once, the goal and target is fixed, then the strategy and tactics should be identified to achieve the target.

Strategy: A strategy is the plan designed to achieve the goal/target. For example, considering above set goal, the strategy is to Use Facebook to increase reach and prospect to customers.

Tactics: This is the way with which strategy will be carried out. For example, the above said strategy is implemented by providing a discount on 1st purchase of all new connections on Facebook and another discount on second purchase for whoever shares the offer post in their timeline.

“Objectives should dictate Tactics. Not the reverse!”

So, Its always a good practice to first set goal, target and then turn to social media with a strategy and tactics to execute it. In this way, the social media team also get a clear picture about their task. Hence, productivity can be ensured!

Social Media & Top 5 Business Functions

A social media program must positively help the organization in a way or the other. It should cater to the needs of the organization. Following are the top 5 business functions to which social media program will help organization:

1. Sales : Ultimate need of any organization is to sell. Make Money. Social Media helps in selling – directly and indirectly. But the point to be considered is, if you focus on selling by being social (in social media), it is going to be very tough. You cannot sell easily being social. But, Social Media can help in driving sales. People can recommend and influence their network to decide on buying your product. Reach, engagement and influence – the three factors to make social media help the organizations sale. Dell is a very early adapter to this strategy and has been very successful till now.

2. Customer Support : People talking about a brand is public in social media. Nowadays, the brand’s customer support team can very easily monitor and keep track of all its mentions on various social media platform. This also provides an opportunity for them to join the conversation if necessary. Consider a situation where a dissatisfied customer makes a negative mention about the brand. Here, if customer support immediately pitches in and addressed the complaint/grievance – It ends up with the customer being satisfied and happy about the quick turn around response of the brand. 🙂 Following are the advantages of adopting social media customer support:

  • Constant real-time feedback from customers and general public.
  • Quick response to mentions.
  • Faster resolution time – Cost reduction compared to other regular modes of customer support
  • Proactive way to keep customers happy

3. Human Resources : When recruiting, one can go through piles of applications or hire through trusted network of peers and colleagues. LinkedIn is the best example which can be quoted here. It has evolved a lot. Recruiters can easily search for people of certain skill set. People can upload their resume, connect to blog, get recommended, join groups, follow companies and many more. from the organizations end, it becomes much easier to find and evaluate a profile for certain position.

4. Public Relations : PR is another area where social media can help an organization significantly. With the ability to keep track of all mentions of the organization, any negative mention taking a hit on reputation can be immediately looked into and responded. Similarly, deliberate attacks or false rumors can also be sighted and addressed quickly! This is called Online/Digital Reputation Management. Crisis Management can also be very well handled in the same way.

5. Business Intelligence : Again, with the power to monitor all the conversations happening online in social media, it enables the organization to identify new trends, customer expectations around a product or domain and make decisions based on that. Also, competitors can be easily monitored and compared to make certain decisions too.

The above mentioned are the business functions for which social media analytics is most commonly used.

Creating the Social Company

“Social Media success doesn’t happen by accident. It is Engineered!”

Any company or brand which has been successful in it’s social media campaigns or other plans, should have put in lot of efforts behind the scenes. Social Media enables people to connect with rest of the word easily, conveniently, meaningfully and in their own terms. Back in olden days, businesses treated customers as friends. The more a customer is welcomed and pampered, the more customer continues to make business and also recommended it to others. Customers were greeted by name on  Over the days, this started fading. And now, again, social media is enabling businesses to get back to that style. It helps brands to get into one-to-one conversation with a large scale of customers.

Social Communication: Social Media is an infrastructure which enables social communication. People share videos, photos, talk, like, express opinions, post thoughts etc on social media. This what people do with social media. And, this activity and interaction is called social communication.

Social Media Program: A social media program planned by any organization cannot be just a marketing plan or blogging. The purpose cannot just be conversation or engagement. It is a force-multiplier. It helps in amplifying any PR or advertising plan implemented by the organization. It can help in providing instant feedback from customers. It also helps in collaboration with customers. Be it Lead generation , Customer retention, Crisis management or Trend identification , a social media program can fit into any need of the organization.

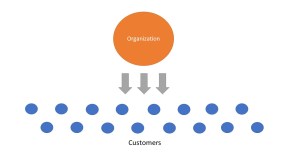
Engagement: Initially, communication between brands and audience was one way. The brand would send a message to audience. The audience would either accept or ignore the message. If at all company wanted to hear from audience, it was through comment cards or customer service.

One Way Communication

One Way Communication

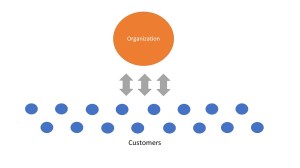
Then, during early Web 2.0, the online experience became more collaborative and user-centric. Blogs, Forums, Comments in websites enabled customers to talk louder and mostly direct to the organization/brand. Customers started feeling the strength of their voice. So did the Organizations.

Two Way Communication

Two Way Communication

Finally, now, social media platforms enable not only communication between organization and customers, but also between customers! This people to people communication has opened the doors to lots of opportunities and challenges for the organizations. On communicating within themselves, people discuss about a brand/product and share review about the same. This influences others in their decision making towards this brand/product. This is called the word-of-mouth. This channel also knows no geographic barrier. It cuts across the globe!

people to people communication

people to people communication

This word-of-mouth has to be positive and should be earned by an organization. And, this is why every brand should integrate Social Media into it’s business model and engineer its success in the same.

Classification & Regression

Classification : Machine Learning is used to label input data based on the training data provided. This labeling of data is called classification. Here, the record is classified into one of the possible groups by the algorithm. The output here is the class labels.

Consider the familiar email Spam Classification example. Here, initially, a set of spam emails are used to train the model and then, any new email that hits your inbox is classified as either spam or not-spam. This is a Classifier Model in Machine Learning.

There various classifier models in practice. The right classifier for a solution depends various factors. Following are few common classifier model and reasons to choose them:

  • Boostingoften effective when a large amount of training data is available.
  • Random trees – often very effective and can also perform regression.
  • K-nearest neighborssimplest thing you can do, often effective but slow and requires lots of memory.
  • Neural networksSlow to train but very fast to run, still optimal performer for letter recognition.
  • SVMAmong the best with limited data, but losing against boosting or random trees only when large data sets are available.

Ref: An answer in Stackoverflow pointing to “OpenCV” book.

Prediction/Regression : Unlike Classification, regression is type of problem where algorithm finds a continuous number/value from the given input. A simple example would be – predict price of an house, given no.of rooms, area and location. Here, a training set of houses with known price are fed into the model. The algorithm comes up with an equation to apply on new inputs further. Another example is predicting the price of a stock, given various input features.

The output here is a continuous value of the target variable.

Training & Test Data

Training Data : This is the data set which has the feature variables and target variable. This data is used to train the algorithm to derive the classification/regression equation. Training data is the data which used by the algorithm to learn from.

Test Data : Test data is the data set which is used to validate the trained algorithm. This data set will also have feature and target variables. The trained algorithm will be executed on the records in test data. Now, the actual value/label in target variable and the output value/label from the algorithm can be compared to measure the accuracy of the trained algorithm. Less the difference, more the accuracy!

Notes : Test Data can be a part of training data itself, but will be hidden from the algorithm during training and used fresh to test later. The test records can be randomly selected from the training data or certain set of records can be selected to be the training data. generally, a % (eg : 20%) of randomly selected records from available data is made as test data.

Linear Regression – Gradient Descent Method

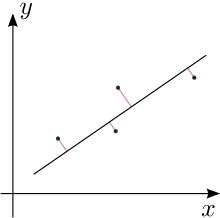
Linear regression is the process of identifying a line/curve – hypothesis using the training data which represents the relation between feature variables and the target variable. In an example of determining the price of a house, given its area, then linear regression finds the relationship between the area and the price of the house. This line/curve should be of minimum error.

The minimum error is determined using loss function and the parameters. The parameters are varied to get the most minimum value of loss function. Basically, loss function denotes the difference between actual target variable value and computed variable value through the equation of hypothesis.

Error

Error

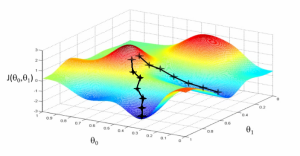
Gradient Descent is one of the method in linear regression which is used to find minimum value of loss function. In an iterative method, the parameters are varied and the equation is computed for a minimum value. This might lead to local or global minimum

Gradient Descent - Iterative Descent to Minimum Value

Gradient Descent – Iterative Descent to Minimum Value

The rate in which the steps are taken towards minimum is determined by learning rate. This has to be defined while training the algorithm. Once this hypothesis is finalized, then any new data passed to the algorithm, the hypothesis will be applied and the value would be calculated.